


 57 / 144

57
OCTA e sem necessidade de recorrer a AF1. Além disso, existem já protótipos
de software que permitem obter imagens compostas do pólo posterior e média
periferia
4,7
, e é expectável que à medida que esta tecnologia evolui maior será
a área analisada, dispensando ainda mais a necessidade de recorrer rotineira-
mente à angiogra%a tradicional.
Referências
1. Ishibazawa A, Nagaoka T, Takahashi A, et al. Optical Coherence Tomography Angio-
graphy in Diabetic Retinopathy: A Prospective Pilot Study. Am J Ophthalmol;
2015;160(1):35–44.e1.
2. Couturier A, Mané V, Bonnin S, et al. Capillary Plexus Anomalies in Diabetic Retinopa-
thy on Optical Coherence Tomography Angiography. Retina; 2015;35(11):2384–91.
3. Lee J, Moon BG, Cho AR, Yoon YH. Optical Coherence Tomography Angiography
of DME and Its Association with Anti-VEGF Treatment Response. Ophthalmology;
2016;123(11):2368–75.
4. de Barros Garcia JMB, Isaac DLC, Avila M. Diabetic retinopathy and OCT angiography:
clinical %ndings and future perspectives. Int J Retin Vitr; 2017;3(1):14.
5. Parravano M, De Geronimo D, Scarinci F, et al. Diabetic Microaneurysms Internal
Re`ectivity on Spectral-Domain Optical Coherence Tomography and Optical Coheren-
ce Tomography Angiography Detection. Am J Ophthalmol; 2017;179:90–6.
6. Hasegawa N, Nozaki M, Takase N, et al. New insights into microaneurysms in the deep
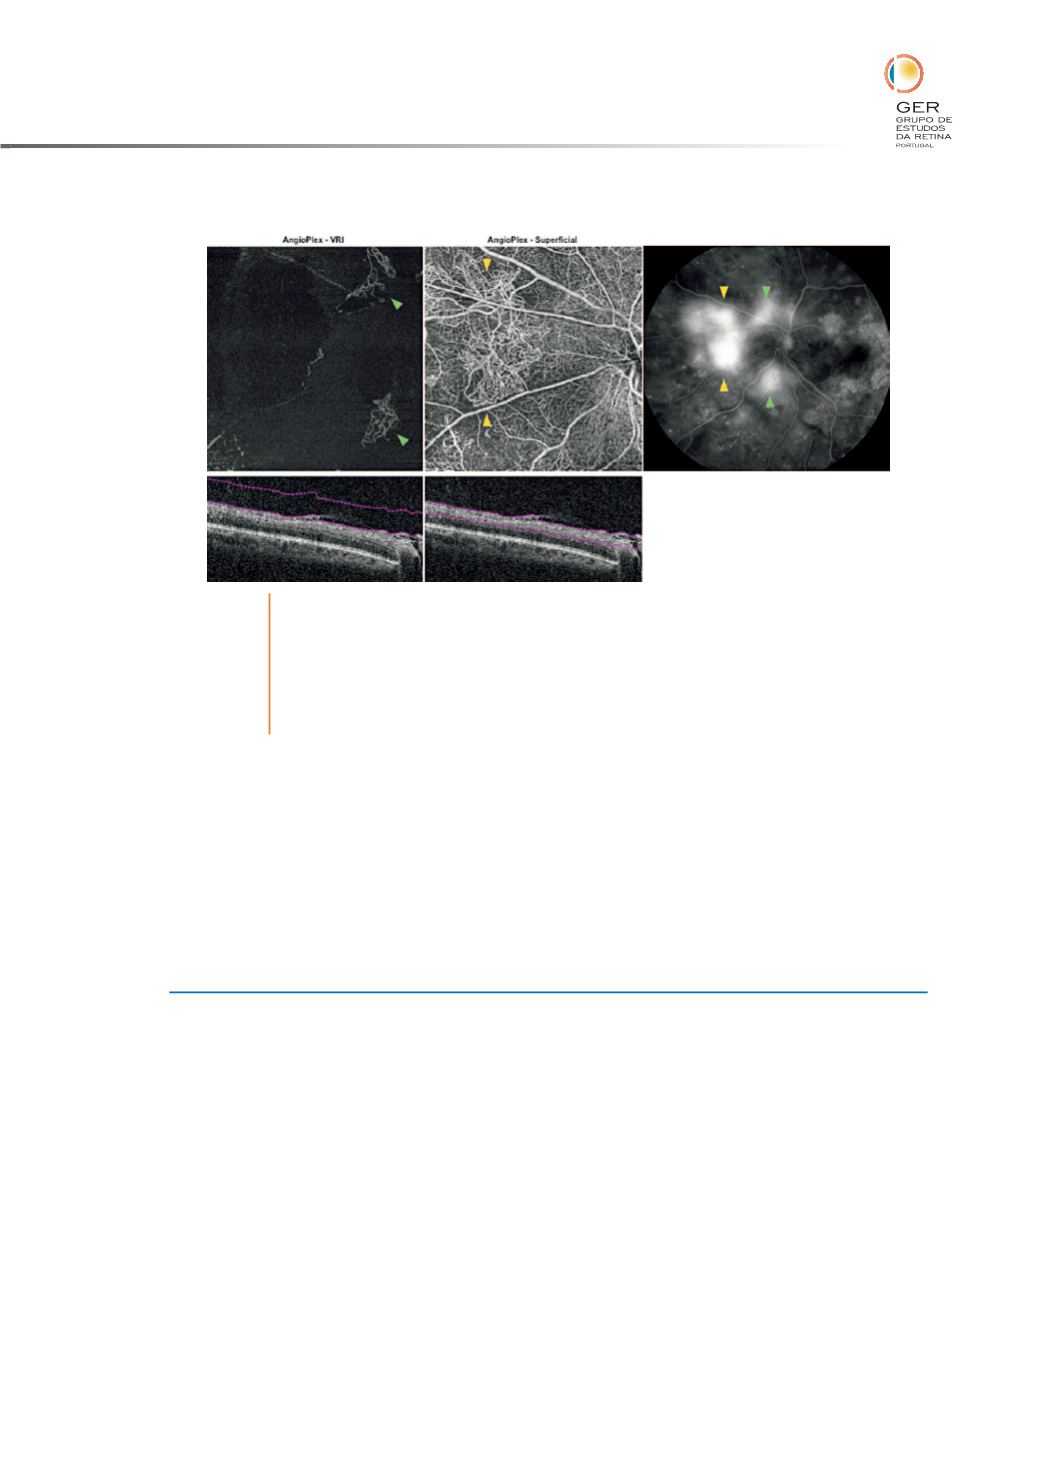
Fig. 4
OCTA e AF na RDP. A segmentação a nível da interface vítreo-retiniana (à
esquerda) e a segmentação a nível do plexo super%cial (ao centro) mostram
a presença de neovasos em toda a sua extensão e com grande detalhe
anatómico (setas verdes e amarelas). De notar que a sua morfologia e
vascularização é muito melhor captada pelo OCTA do que pela AF, visto
nesta estarem mascarados pelo derrame intenso.