


 105 / 127

103
Capítulo 21. Qual a estratégia de realização
da tomografia de coerência óptica que devemos utilizar na patologia da interface?
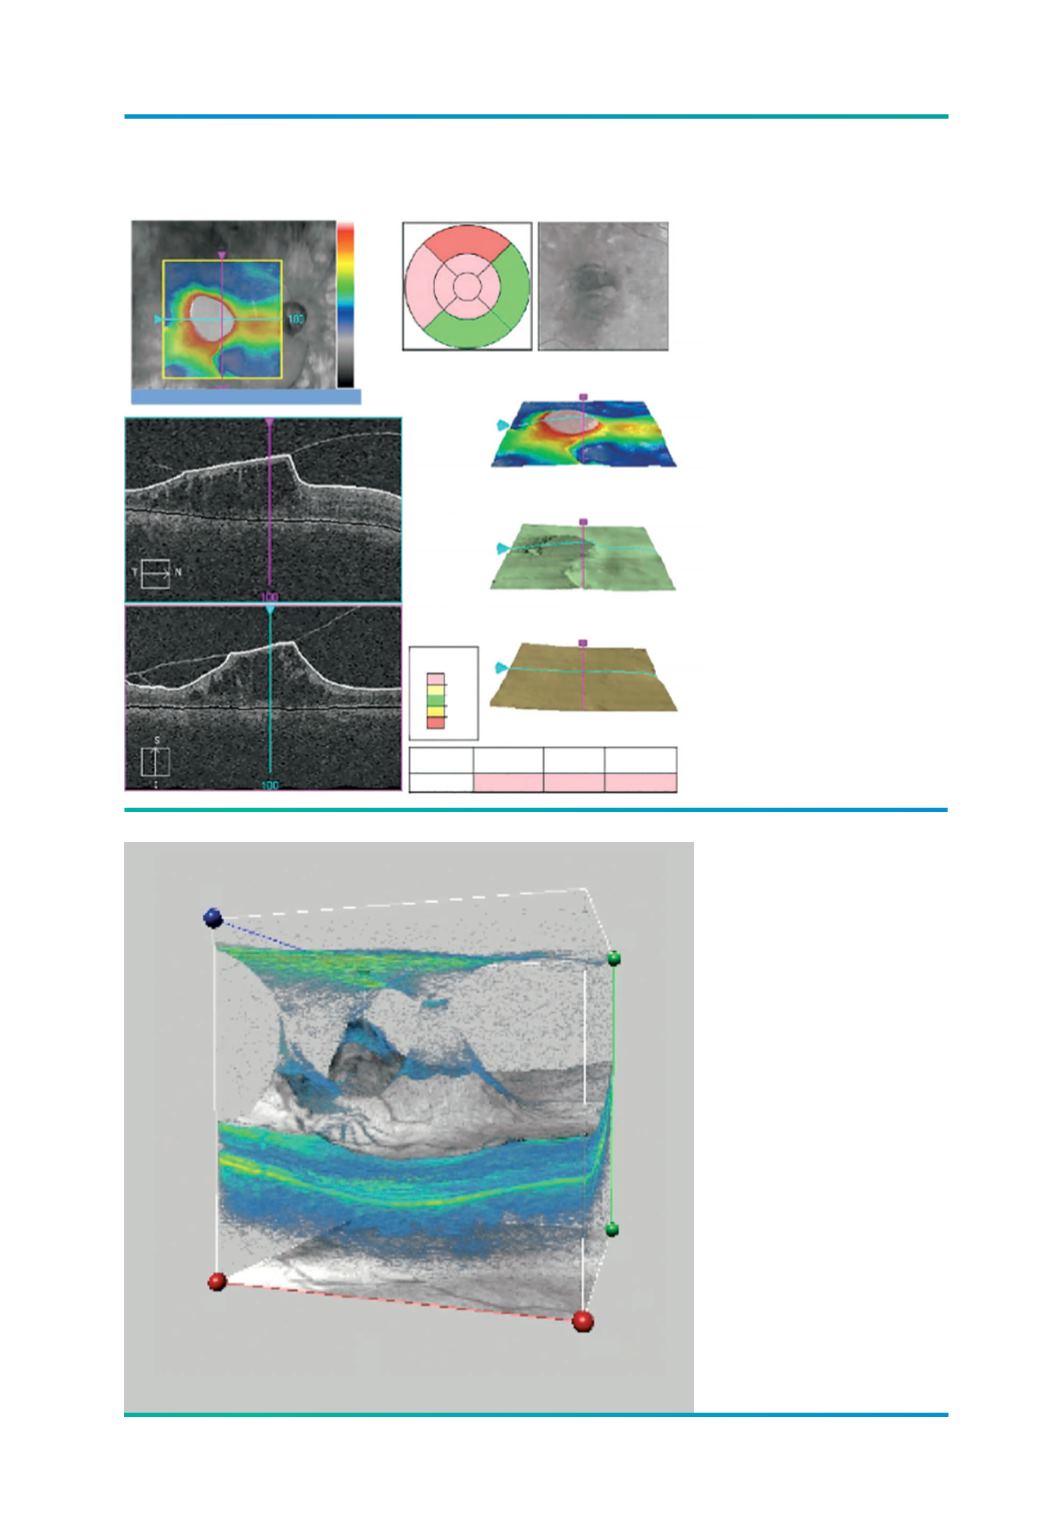
Figura 9.
Imagem 3D – Tracção na
fóvea e junto das arcadas.
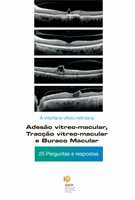
Figura 8.
Mapa de espessura.
ILM-RPE Thickness (
m
m)
Fovea: fovea not found
ILM-RPE
ILM
RPE
Distribución
of Normals
Overlay: ILM - RPE Trasparency: 50%
Central subfield
Thickness (
m
m)
Cube Volume
(
m
m)
Cube Average
Thickness (
m
m)
ILM-RPE
664
11,4
315
99%
95%
5%
1%
500
400
300
200
100
0
m
m
225
417
339 569 664 374 315
453
275
200
I
T
1
1
1
1
24